CLASS-9
RAW OR UNGROUPED DATA
Raw or Ungrouped Data –
The data obtained in original form are called “raw data or ungrouped data”.
Example – The marks obtained by 30 students in a class in a certain examination are given below-
25, 8, 37, 16, 45, 40, 29, 12, 42, 40, 28, 32, 43, 42, 41, 25, 15, 16, 26, 20, 14, 36, 33, 24, 25, 35, 11, 30, 47, 48.
Above date is raw data.
Array :- An arrangement of raw data in ascending or descending order of magnitude is called an “array”. Arranging the marks of 30 students in ascending order, we get the following array.
8, 11, 12, 14, 15, 16, 16, 20, 24, 25, 25, 25, 26, 28, 29, 30, 32, 33, 35, 36, 37, 40, 40, 41, 42, 42, 43, 45, 47, 48.
To prepare a Frequency Distribution Table for Raw data using Tally Marks:
We take each observation from the data, one at a time, and indicate the frequency (the number of times the observation has occurred in the data) by small lines is to be considered or known as Tally Marks. For convenience, we write tally marks in bunches of five (5), the fifth one crossing the fourth diagonally. In the table so formed, the sum of all the frequencies is equal to the total number of observations in given data.
Example- The sale of dress of various sizes at a shop, on a particular day is given below –
9 11 22 20 14 16 8 9 10 12 11 22 18 16 18 8 11 22 16 10 20 14 8 9 11 12 22 8 8
22 16 14 18 11 12 22 16 20 9 10 14 11 22 9 11 22 16 10 12 22 8 11 9 14 8 9 10 12
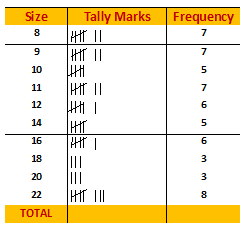
The above data is clearly raw data. From this data, we construct a frequency table, as given below –
Frequency Table -