CLASS-9
DISTRIBUTION METHOD OF FORMING A CLASS OF DATA
Method of Forming Classes of a Data –
1. First of all we have to determine the maximum and minimum values of the variate occurring in the data.
2. Second of all we have to decide upon the number of classes to be formed.
3. Third of all we have to find the range, i.e., the difference between the maximum value and the minimum value. Divide the range by the number of classes to be formed to get the class size.
4. At the end of that process, by counting, we obtain the frequency of each class.
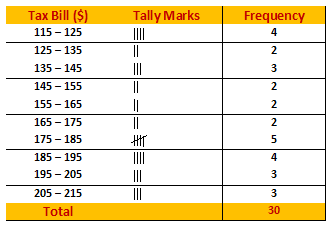
Example) The house tax bills (in dollar $) of 30 houses in a locality are given below –
147, 167, 136, 178, 175, 116, 155, 121, 115, 156, 176, 141, 189, 167, 177, 208, 212, 143, 203, 210, 188, 178, 212, 118, 197, 145, 134, 133, 196, 185. Construct a frequency distribution table with class size 10.
Ans.) Minimum observation = 115, Maximum observation = 212
Range = Maximum Observation – Minimum Observation
= 212 – 115 = 97
Class Size = 10
Since, 97 ÷ 10 = 9.7, we should have 10 classes, each of size 10. These classes are –
115 – 125, 125 – 135, 135 – 145, 145 – 155, 155 – 165, 165 – 175, 175 – 185, 185 – 195, 195 – 205, 205 – 215.
So, the frequency distribution table may be presented as shown below –