CLASS-6
PIE CHART - PROBLEM & SOLUTION
PIE CHART - PROBLEM & SOLUTION -
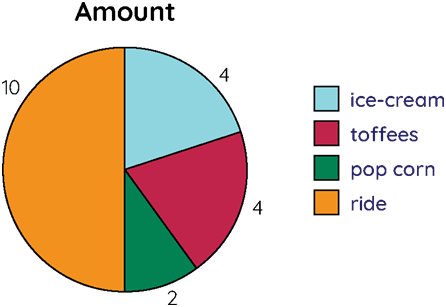
Example.1) Observe the following pie chart that represents the money spent by Ana at the funfair. The indicated color shows the amount spent on each category. The total value of the data is 20 and the amount spent on each category is interpreted as follows:
· Ice Cream - 4
· Toffees - 4
· Popcorn - 2
· Rides - 10
Ans.) To convert this into pie chart percentage, we apply the formula:-
(Frequency ÷ Total Frequency) × 100
Let us convert the above data into a percentage.
Amount spent on rides: (10/20) × 100 = 50%
Amount spent on toffees: (4/20) × 100 = 20%
Amount spent on popcorn: (2/20) × 100 = 10%
Amount spent on ice-cream: (4/20) × 100 = 20% (Ans.)
Example.2) Observe the following pie chart that recommends a low-carb diet on a day.
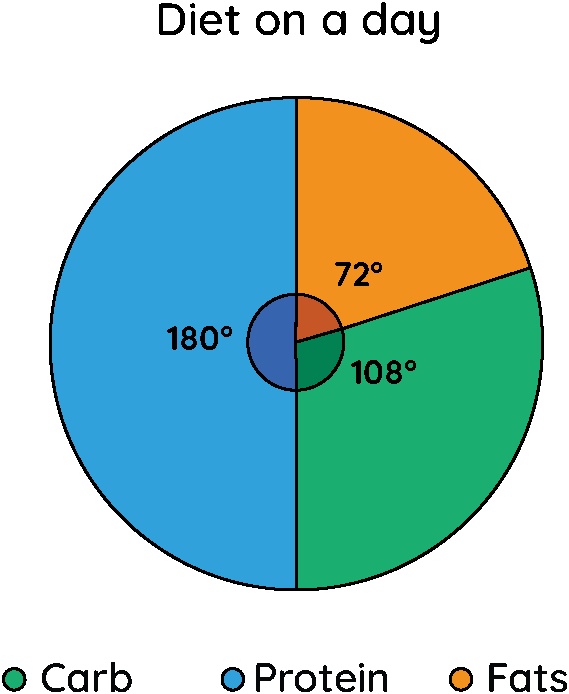
Ans.) We measure the angles of each slice. We get that Protein measures 180°, Carb measures 108°, and Fats measures 72°.
To find the percentage, we divide each angle by 360 and multiply it by 100.
Protein = (180/360) × 100 = 50%
Carb = (108/360) × 100 = 30%
Fats = (72/360) × 100 = 20%
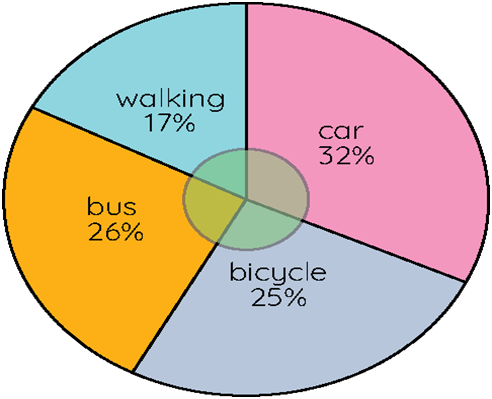
Example.3) The pie chart shown below shows the percentages of types of transportation used by 500 students to come to school. With this given information, answer the following questions:
a) How many students come to school by bicycle?
b) How many students do not walk to school?
c) How many students come to school by bus and car?
Ans.)
a) The students who come by bicycle = 25%; (25/100) × 500 = 25 × 5 = 125.
b) The students who do not walk to school- We need to add the values of all the remaining means, i.e., bus + car + bicycle = 26 + 32 + 25 = 83.
Hence, (83/100) × 500 = 83 × 5 = 415 students do not walk to school.
c) The students who come by bus and car [(32 + 26)/100] × 500 = 58 × 5 = 290.
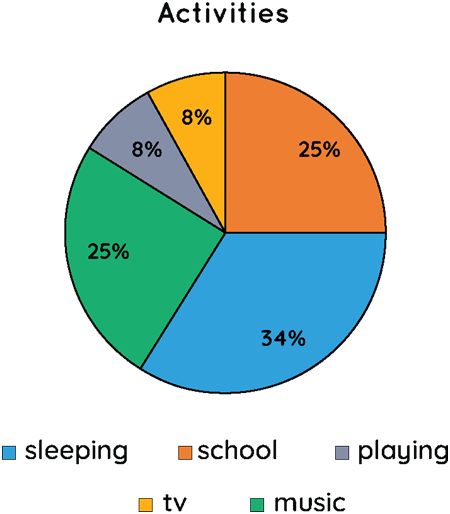
Example.4) The following chart shows the various activities done by Diana in a week.
a) Calculate the central angle subtended at sleeping.
b) Find the portion of time spent by Diana at school.
c) Find the central angle subtended in playing.
Ans.)
a) Time spent in sleeping = 34%; (34/100) × 360 = 122.4°. Therefore, the central angle subtended at sleeping = 122.4°.
b) Time spent at school = 25%; 25/100 = 1/4. Therefore, she spends 1/4th of her time in school.
c) Time spent on playing = 8%; (8/100) × 360 = 28.8°. Therefore, the central angle subtended at playing = 28.8°.
Example.5) The pie chart shows the favorite subjects of students in a class. Using the information given in the pie chart, find the percentage of students who chose English.
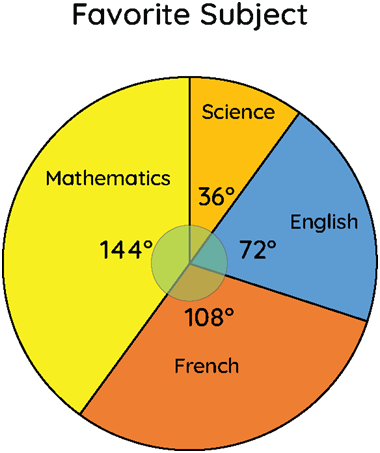
Ans.) Let's first determine the percentage of students who chose English by looking at the pie chart.
We know that 144° + 36° + 72° + 108°= 360°
The percentage of students who chose English:- (72/360) × 100 = 20 Therefore, the percentage of students who chose English = 20% (Ans.)
Example.6) A pie chart is divided into 3 parts with the angles measuring as x, 4x, and 5x respectively. Find the value of x in degrees.
Ans.)
We know, the sum of all angles in a pie chart would give 360º as result.
⇒ x + 4x + 5x = 360º
⇒ 10 x = 360º
⇒ x = 360º/10
⇒ x = 36º
Therefore, the value of x is 36º.