CLASS-11
GRAPHS OF REAL FUNCTIONS
GRAPHS OF REAL FUNCTIONS -
real functions can take many forms and shapes, depending on their equations and parameters. Here are a few examples of graphs of real functions:
- Linear Function:- The graph of a linear function is a straight line. It has the form f(x) = mx + b, where m is the slope of the line and b is the y-intercept. Example:-f(x) = 2x + 3
- Quadratic Function:- The graph of a quadratic function is a parabola. It has the form f(x) = ax²+ bx + c, where a, b, and c are constants. Example:-f(x) = x²− 4x + 4.
- Exponential Function:- The graph of an exponential function is a curve that increases or decreases exponentially. It has the form f(x) = a⋅b^x, where a and b are constants. Example:-f(x) = 2x
- Trigonometric Function:- Trigonometric functions like sine, cosine, and tangent produce periodic graphs. Example:-f(x) = sin(x).
- Logarithmic Function:- The graph of a logarithmic function is a curve that increases or decreases logarithmically. It has the form f(x) = logₑ(x), where e is the base of the logarithm. Example:-f(x) = log(x).
- Sine Function:-f(x) = sin(x), Cosine Function:-f(x) = cos(x), Tangent Function:-f(x) = tan(x).
- Piecewise Functions:- These functions are defined by different expressions over different intervals.
The graphs of a function f consists of all points (x, y) such that y = f(x). To graph a function we carry out three steps:-
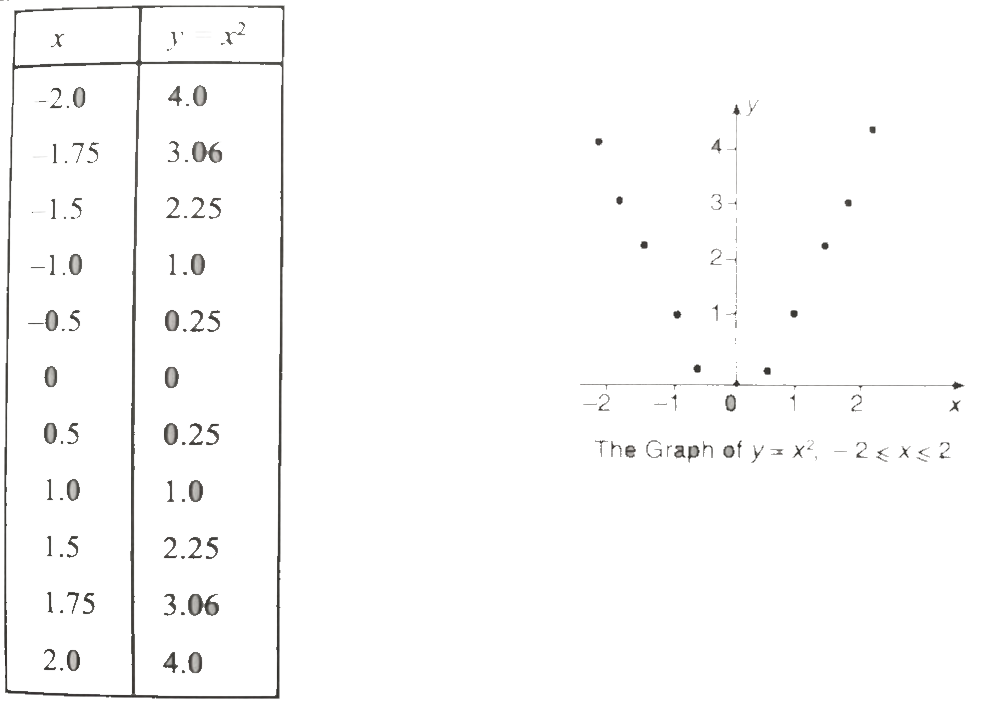
Step.1) Make a table of pairs from the function.
Step.2) Plot enough of the corresponding points to learn the shape of the graph. Add more pairs to the table if necessary.
Step.3) Complete the sketch by joining the points.
Illustration. Suppose we have to draw the graph of function y = x² over the interval - 2 < x < 2.

We have graphed the function y = x² over the interval - 2 ≤ x ≤ 2.

The domain and range of y = x² are both infinite, so we can not hope to draw the entire graph. But we can imagine what the graphs looks like by examining the formula y = x² and by looking at the picture we already have. As x moves away from the interval -2 ≤ x ≤ 2 in either direction y = x² increase rapidly. When x is 6, y is 36. when x = 12, y is 144. Continuing the pattern we see that the graph goes up as shown in above figure.
The basic idea for graphing curves that are not straight lines is to plot points until we see the curve's shape, and then to use the formulae for y to find out how y changes as x moves between or away from the plotted values. But what points should we plot? Here are some guidelines about choosing good points to plot.
Guidelines for choosing points for graphing y = f(x):-
1) Plot any points where the graph crosses or touches the axes. These points are often easy to find by setting y = 0 and x = 0 in the equation y = f(x).
2) Plot a few points near the origin. When the value of x are small, the value of y are often easy to compute or estimate.
3) Graph the function at or near any end points of its domain.