CLASS-10
METHOD
OF SOLVING A LINEAR INEQUATION IN ONE VARIABLE
Method of Solving a Linear Inequation in One Variable –
(i) Simplify both sides by removing group symbols and collecting like terms.
(ii) Remove fractions (or decimals) by multiplying both sides by an appropriate factor (L.C.M of Fractions or a power of 10 in case of decimals.)
(iii) Collect all variable terms on one side and all constants on the other side of the inequality sign. Collect like terms when possible.
(iv) Make the coefficient of the variable 1.
(v) Choose the solution set from the replacement set.
Some special sets of numbers shown on number line –
We would like to have a glimpse on how we present sets of numbers on number line. Some sets of numbers and their graphs are given below
Graphs of Subsets of N, W, and I
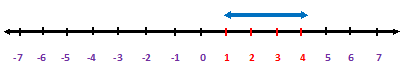
(i) Graph of {x : - 1 < x < 5, x ϵ N} = {1, 2, 3, 4, 5}
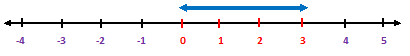
(ii) Graph of {x : -1 < x < 4, x ϵ W} = {0, 1, 2, 3}
(iii) Graph of {x : x > 2, x ϵ N} = {3, 4, 5, 6, 7, …………}
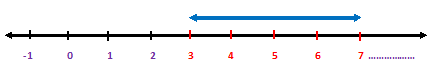
The dot points indicates the natural numbers contained in the set and similarly continued dotted points above the right part of the line show that natural numbers are continued indefinitely.
(iv) Graph of {x : x < -1, x ϵ I} = {-2, -3, -4, -5, ………….}
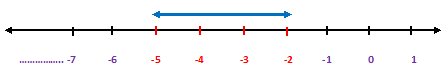
The dot points show the integers contained in the set and three dark dots above the left part of the line show the indefinite continuity of negative integers.
Graphs of sets of all real numbers between two given numbers –
We show the end points of the set by two red color point, namely a hollow circle for the number not contained in the set and the blue color both side arrow area for the number contained in the set, and the line segment between these circles is shown by blue colored line.
(v) Graph of {x : - 1 ≤ x ≤ 3, x ϵ R}
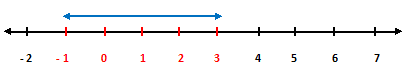
Note that, the end points -1 and 3 are both contained in the set.
(vi) Graph of {x : - 2 ≤ x < 4, x ϵ R}
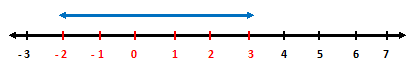
Note that – 2 is there in the given set while 4 is not contained in it
Graphs of {x : x > a, x ϵ R} and {x : x ≥ a, x ϵ R} -
Such a set has one end point. The ray to the right of this point is denoted by blue color both side arrow. If the end point is contained in the set, then it is shown by a blue color both side arrow line.
(i) Graph of {x : x ≥ 4, x ϵ R}
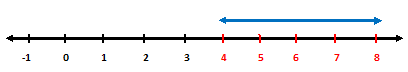
Note that the end point 4 is continued in the given set.
(ii) Graph of {x : x > 3, x ϵ R}
Your second block of text...